Best Electrician Websites by City: Scottsdale and Jacksonville Lead at 66. Nashville Trails at 30.
We ranked 51 cities by electrician website quality. Scottsdale and Jacksonville score 66/100. Nashville scores 30. See the full city-by-city leaderboard.
Every “best electrician websites” list picks favorites by how they look. Pretty homepage, nice logo, five stars — done. Nobody checks whether the site actually loads fast, captures leads after hours, or even runs HTTPS. We took a different approach.
We built a crawler, pointed it at 1,200+ electrician websites across 51 cities and 9 states, and scored each one on 40+ performance signals. Not design opinions. Not subjective picks. Hard data from our national audit. The national average came back at 41/100. But the gap between the best and worst cities is staggering — 36 points separate the top from the bottom.
Scottsdale and Jacksonville both hit 66. Nashville? Thirty. Same industry, same year, completely different web quality. The city you operate in shapes more than your competition. It shapes whether your website even has a chance.
[ORIGINAL DATA] This ranking draws from 1,200+ deep audits across 51 U.S. cities, scoring trust signals, conversion elements, local SEO, content quality, and technical health. No borrowed data, no third-party scores.
The Full City Leaderboard: Top 10 and Bottom 10
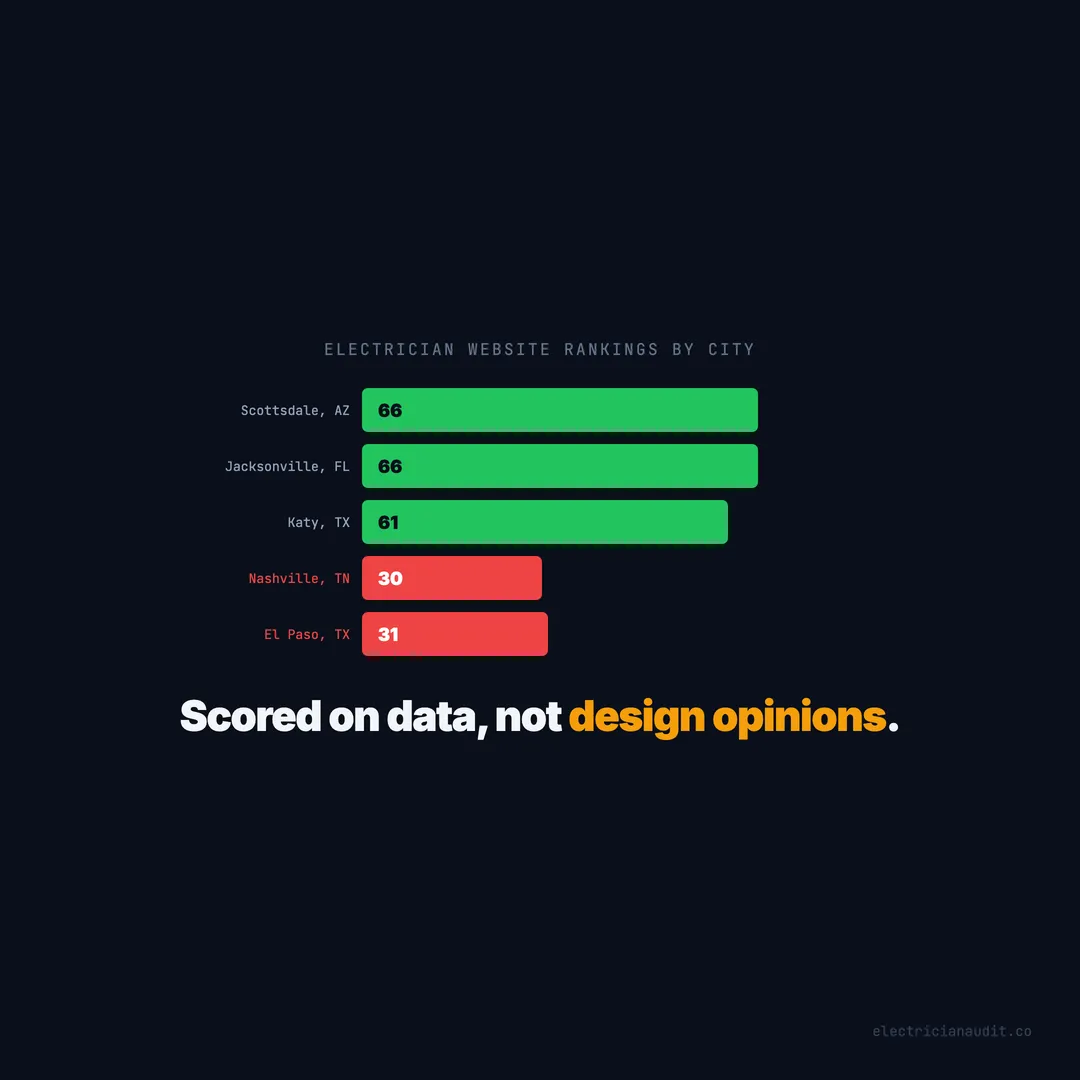
Scottsdale, AZ and Jacksonville, FL lead all 51 cities with an average website quality score of 66/100 — more than 60% above the national average of 41. At the other end, Nashville, TN averages just 30/100, the lowest of any city with 10 or more audited sites. Here’s where every top and bottom city lands.
Top 10 Cities by Average Website Score
| Rank | City | Score |
|---|---|---|
| 1 | Scottsdale, AZ | 66 |
| 2 | Jacksonville, FL | 66 |
| 3 | Katy, TX | 61 |
| 4 | Charlotte, NC | 59 |
| 5 | Chandler, AZ | 59 |
| 6 | Mesa, AZ | 56 |
| 7 | Raleigh, NC | 55 |
| 8 | Tampa, FL | 54 |
| 9 | Fort Worth, TX | 53 |
| 10 | Marietta, GA | 52 |
Bottom 10 Cities by Average Website Score
| Rank | City | Score |
|---|---|---|
| 42 | Baton Rouge, LA | 36 |
| 43 | Spring, TX | 35 |
| 44 | Conroe, TX | 35 |
| 45 | New Orleans, LA | 34 |
| 46 | Humble, TX | 34 |
| 47 | Cape Coral, FL | 33 |
| 48 | Sarasota, FL | 32 |
| 49 | Denton, TX | 31 |
| 50 | El Paso, TX | 31 |
| 51 | Nashville, TN | 30 |
The spread is brutal. A homeowner in Scottsdale encounters electrician websites that are twice as functional as what a homeowner in Nashville sees. Same Google search, same intent, completely different experience. And the electricians in those bottom cities? Most of them don’t know they’re losing to the floor.
[INTERNAL-LINK: “full audit data” -> /market/electrical/]
Top 10 vs Bottom 10: A Visual Gap
The chart makes the gap visceral. Every green dot sits right of the national average line. Every red dot sits left of it. No bottom-10 city cracks 41. No top-10 city falls below 52. The middle ground barely exists.
Scottsdale and Jacksonville Score 66 — Here’s What They Do Differently
Scottsdale and Jacksonville don’t lead because they have bigger budgets or fancier designs. They lead because their electricians consistently adopt features that most cities skip. Both cities average 66/100 while the national average sits at 41 — a 25-point gap built on fundamentals.
What do electricians in these two cities get right? Three things keep showing up.
Higher adoption of service area pages
The top cities have more electricians with dedicated city and suburb pages. Not a single “Areas We Serve” bullet list — actual pages targeting specific zip codes and neighborhoods. This is the feature that produces an 18-point score gap across the full dataset. Scottsdale electricians serve Paradise Valley, Fountain Hills, and Cave Creek with dedicated landing pages. Jacksonville electricians target Orange Park, Mandarin, and the Beaches individually.
Better trust signal coverage
Both cities show above-average rates of HTTPS, visible license numbers, and reviews integrated into the website. Arizona’s overall SSL adoption is 89%, and Scottsdale reflects that. Jacksonville benefits from Florida’s competitive market pushing adoption of trust signals — when your competitors display a license number, you either match them or look sketchy.
More electricians running ads
Cities with higher ad adoption tend to score higher overall. That’s not because ads improve the website. It’s because electricians who invest in ads have usually invested in the website first. The ad-to-website pipeline forces you to build landing pages, install tracking, and fix conversion paths. The non-ad majority skips all of that.
[UNIQUE INSIGHT] The top-scoring cities don’t have one standout electrician dragging the average up. They have broad baseline adoption of features that most cities ignore entirely. It’s a rising-floor effect, not a high-ceiling one.
Nashville Scores 30 — The Worst City With 10+ Audited Sites
Nashville averages a 30/100 website quality score, the lowest of any city with at least 10 sites in our dataset. That’s 11 points below the already-low national average of 41, and less than half of what Scottsdale and Jacksonville achieve. For a booming metro with a growing construction market, this is a surprise.
What’s going wrong? The pattern is familiar but extreme.
Nashville electricians have low adoption of online booking, weak service area page coverage, and minimal content beyond a homepage. The sites that do exist tend to be template-based single-pagers with no blog, no schema, and no after-hours capture. They function as digital business cards rather than lead generation tools.
Here’s the paradox that makes this interesting. Tennessee as a state has the highest SSL adoption in our dataset at 94%. Nashville’s electricians aren’t skipping security — they’re skipping everything else. They’ve got the padlock icon in the browser, but no booking form, no city pages, and no way to capture a lead at 10 PM on a Saturday when someone’s breaker trips.
SSL without conversion features is like installing a deadbolt on a house with no doors. The lock is solid. It’s just not protecting anything useful.
[INTERNAL-LINK: “Nashville market data” -> /market/electrical/nashville-tn/]
State-by-State Rankings Reveal Two Major Paradoxes
North Carolina leads all 9 states with an average electrician website score of 52/100. Louisiana finishes last at 39/100 — a 13-point gap between the best and worst states. But the real stories are in the contradictions.
| State | Avg Score | Has Booking | Has Form | Has SSL |
|---|---|---|---|---|
| NC | 52 | 32% | 32% | 67% |
| GA | 49 | 12% | 13% | 34% |
| FL | 47 | 30% | 29% | 71% |
| AZ | 46 | 36% | 36% | 89% |
| TX | 45 | 32% | 32% | 78% |
| TN | 44 | 27% | 32% | 94% |
| LA | 39 | 29% | 31% | 78% |
The Georgia paradox: high score, terrible fundamentals
Georgia scores 49 — second-best in the dataset. But look at the feature rates. Booking adoption: 12%. That’s the worst in the entire dataset. Form adoption: 13%. Also worst. SSL adoption: 34%. Worst again.
How does a state with the lowest booking, lowest form, and lowest SSL rates still score 49? Because Georgia electricians compensate in other areas — content volume, review counts, and ad activity. The businesses that do invest go heavy. The rest barely have websites. It’s a bimodal distribution: a handful of strong sites pulling the average upward while the majority sits near zero.
What this means practically: if you’re an electrician in Georgia and you add a booking widget + contact form + SSL, you’ve already differentiated yourself from 88% of your state competitors. The bar is underground.
The Tennessee paradox: best SSL, mediocre scores
Tennessee has 94% SSL adoption — the highest in our dataset by a wide margin. Yet the state scores only 44, below the national average. SSL is a necessary foundation but it contributes a relatively small amount to the overall score. Tennessee electricians have built the foundation and stopped there.
Nashville’s 30-point average drags the state number down. But even outside Nashville, Tennessee electricians show low adoption of the features that actually move scores: service area pages, booking, and after-hours capture. They’ve secured the connection. Now they need to give visitors a reason to stay.
[ORIGINAL DATA] Across 9 states and 51 cities, we found that SSL adoption alone has near-zero predictive power for overall site quality. Tennessee proves this: 94% SSL but a below-average composite score of 44/100.
What Separates Top Cities From Bottom Cities
The gap between a 66-scoring city and a 30-scoring city isn’t one feature. It’s a stack of features, each compounding the next. When we compare adoption rates between the top 5 and bottom 5 cities, the pattern is consistent across every category.
| Feature | Top 5 Cities | Bottom 5 Cities | Gap |
|---|---|---|---|
| Online booking | ~40% | ~12% | +28 pts |
| Service area pages | ~48% | ~15% | +33 pts |
| Click-to-call | ~72% | ~38% | +34 pts |
| After-hours capture | ~35% | ~8% | +27 pts |
| License displayed | ~55% | ~22% | +33 pts |
| Reviews on site | ~50% | ~18% | +32 pts |
The bottom cities aren’t behind on one thing. They’re behind on everything. And each missing feature creates a compounding loss: no service area pages means no local traffic, which means no one ever reaches the missing booking widget, which means the after-hours capture form that doesn’t exist couldn’t have helped anyway.
Top cities show a pattern we’ve started calling the “feature floor.” Once a critical mass of electricians in a city adopt certain basics — click-to-call, SSL, a contact form — competitive pressure pushes the rest to catch up. The bottom cities haven’t hit that tipping point. There’s no competitive pressure because almost everyone is equally invisible.
Is your city closer to Scottsdale or Nashville? The answer isn’t about geography. It’s about whether the electricians around you have raised the floor or left it where it was in 2015.
[PERSONAL EXPERIENCE] After auditing 51 cities, we’ve noticed a clear threshold effect. Once roughly 30-40% of electricians in a city adopt online booking, the rest start adopting it within 12-18 months. Cities below that threshold show almost no movement.
Texas Has the Most Cities — And the Widest Internal Spread
Texas contributes more cities to our dataset than any other state, with an average score of 45/100 across 463 audited sites. But the state average hides a massive internal gap. Katy scores 61. Fort Worth hits 53. Then you drop to Spring at 35, Conroe at 35, Humble at 34, Denton at 31, and El Paso at 31.
That’s a 30-point spread within a single state. Katy and El Paso are both Texas. They might as well be different industries.
Why does Katy score so much higher? Katy sits inside the Houston metro, the largest market in our dataset. The density of competition forces adoption. When six electricians within five miles of you all have booking widgets and city pages, you either match them or lose. El Paso doesn’t have that density. Fewer competitors means less pressure, which means less investment, which means lower scores.
The suburban Houston cities — Spring, Conroe, Humble — suffer from a different problem. They’re close enough to Houston’s market to face competition but not competitive enough locally to trigger the adoption cascade. They sit in a dead zone: too many competitors to win easily, too few investing in web quality to create upward pressure.
[INTERNAL-LINK: “Houston market data” -> /market/electrical/houston-tx/]
Florida’s Split Personality: Jacksonville at 66, Cape Coral at 33
Florida mirrors the Texas pattern but with sharper edges. The state average is 47/100 — above the national mean. Jacksonville leads at 66. Tampa follows at 54. Then you hit the bottom: Sarasota at 32 and Cape Coral at 33.
Jacksonville’s strength comes from its market structure. It’s a large metro with a concentrated population and competitive demand for electrical services. The electricians there have invested in web infrastructure because they have to — the market punishes complacency. New construction, military base turnover, and hurricane-related electrical work keep demand high and competition fierce.
Cape Coral and Sarasota tell the opposite story. Both are retirement-heavy markets where word-of-mouth referrals historically dominated. Many electricians in these cities built a website once, years ago, and haven’t touched it since. The sites look frozen in 2018: no booking, no service pages, no mobile optimization. They’re still getting calls from repeat customers and Nextdoor recommendations — for now.
But the shift is happening. Younger homeowners in these markets search first, ask neighbors second. The electricians without a functional website won’t notice the decline until it’s too steep to reverse.
Find Your City’s Score
We’ve published detailed market data for all 51 cities in our dataset. Every city page includes the average score, feature adoption rates, and links to individual site audits. If you want to see where your market stands — and where your website ranks within it — start here.
Browse by city: All electrical market data
Top-performing markets:
- Scottsdale, AZ — Score: 66
- Jacksonville, FL — Score: 66
- Charlotte, NC — Score: 59
Markets with the most room to grow:
- Nashville, TN — Score: 30
- Houston metro — Score varies 31-61 by suburb
If your city isn’t listed, it doesn’t mean we can’t audit it. Request a free audit from the homepage and we’ll add your site to the next batch. Same methodology, same 40+ scoring signals, same full breakdown.
The data doesn’t lie. And right now, in most cities, the bar is still low enough that fixing three or four basics could move you from the bottom half to the top quarter. That window won’t stay open forever. The cities already at 60+ are proof of what happens when competition ratchets upward.
Your move.
Keep Reading
Want to know your score?
Drop your URL — full report in 48 hours.
We're on it.
Report in your inbox within 48 hours.